https://jlajara.gitlab.io/posts/2018/11/26/process-migration.html
https://security.stackexchange.com/questions/90578/how-does-process-migration-work-in-meterpreter
What is process migration in Meterpreter?
After a successful exploitation, such as, tricking a victim to execute a Meterpreter executable, gaining RCE an executing a generated Meterpreter payload with Unicorn, propagating shells with multirelay… Sometimes, Meterpreter process has to be migrated to:
- Hiding the process to gain persistence and avoid detection.
- Change the process architecture to execute some payloads with the corrent architecture. For example, if there is a 64-bits system and our meterpreter process is 86-bits, some architecture-related problems could happen if we try to execute some exploits against the session gained.
- Migrate to a more stable process.
How it works?
- 1 A metasploit handler is configured to retrieve a meterpreter sessions.
- 2 Processes are listed to select the desired one to migrate (
pscommand). - 3 Migrate to the desired process (
migrate <PID>)
In the following example, the meterpreter session is retrieved in an .exe file that creates the process goodFile.exe. This process is quite noisy, if the user closes this process, the session will be closed. Therefore, migrating to a more stable process like explorer.exe would give us the ability to hide the meterpreter session and gain persistance.
Attacker’s view:
Victim’s view:

Debugging MSFConsole
MSFConsole could be easily debugged with Pry-Byebug. The installation is easy and described in the previous link. Now, we have to edit msfconsole binary to show the use of pry-byebug.
> vim msfconsole
Insert require 'pry-byebug'
#!/usr/bin/env ruby
# -*- coding: binary -*-
#
# This user interface provides users with a command console interface to the
# framework.
#

#
# Standard Library
#

require 'pathname'
require 'pry-byebug'

if ENV['METASPLOIT_FRAMEWORK_PROFILE'] == 'true'
Now, in the meterpreter source code, we introduce binding.pry in the line desired line that the debugger should stop.
vim lib/rex/post/meterpreter/client_core.rb
#
  # Migrates the meterpreter instance to the process specified
  # by pid.  The connection to the server remains established.
  #
  def migrate(target_pid, writable_dir = nil, opts = {})
    binding.pry

    keepalive              = client.send_keepalives
    client.send_keepalives = false
    target_process         = nil
    current_process        = nil

    # Load in the stdapi extension if not allready present so we can determine the target pid architecture...
    client.core.use('stdapi') if not client.ext.aliases.include?('stdapi')

    current_pid = client.sys.process.getpid

    # Find the current and target process instances
    client.sys.process.processes.each { | p |
      if p['pid'] == target_pid
        target_process = p
      elsif p['pid'] == current_pid
        current_process = p
      end
    }

...
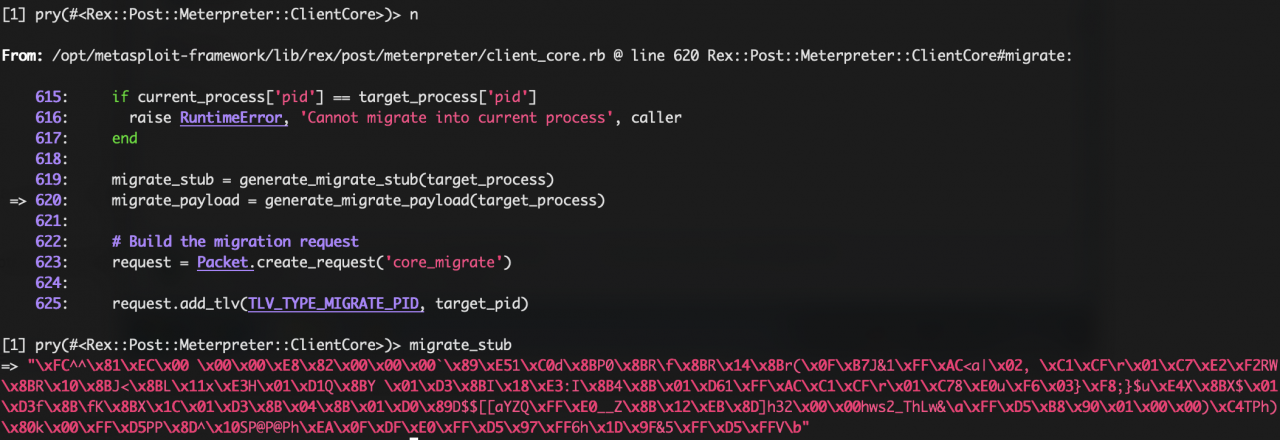
When the migration process is initiated, the debugger stops at the desired line:

We can see the value of the variables introducing it’s name:
Migration process detailed
- 1 Get the PID the user wants to migrate into. This is the target process.
- 2 Check the architecture of the target process whether it is 32 bit or 64 bit. It is important for memory alignment.
- 3 Check if the meterpreter process has the SeDebugPrivilege. This is used to get a handle to the target process.
- 4 Get the actual payload from the handler that is going to be injected into the target process. Calculate its length as well.
- 5 Call the OpenProcess() API to gain access to the virtual memory of the target process.
- 6 Call the VirtualAllocEx() API to allocate an RWX (Read, Write, Execute) memory in the target process
- 7 Call the WriteProcessMemory() API to write the payload in the target memory virtual memory space.
- 8 Call the CreateRemoteThread() API to execute the newly created memory stub having the injected payload in a new thread.
- 9 Shutdown the previous thread having the initial meterpreter running in the old process.
Detection with Procmon
Process Monitor is an advanced monitoring tool for Windows that shows real-time file system, Registry and process/thread activity. It combines the features of two legacy Sysinternals utilities, Filemon and Regmon, and adds an extensive list of enhancements including rich and non-destructive filtering, comprehensive event properties such session IDs and user names, reliable process information, full thread stacks with integrated symbol support for each operation, simultaneous logging to a file, and much more. Its uniquely powerful features will make Process Monitor a core utility in your system troubleshooting and malware hunting toolkit.
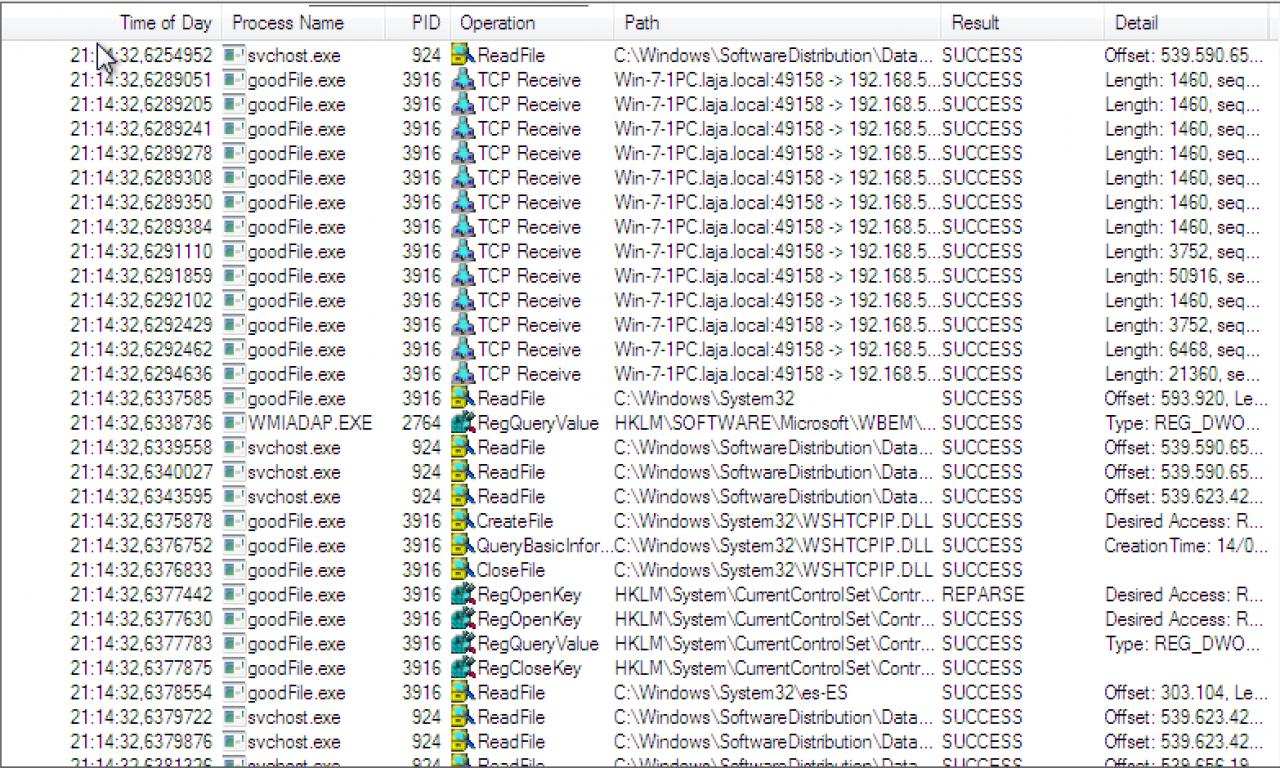
In the next example, goodFile.exe is receiving connections and starting the migration process.
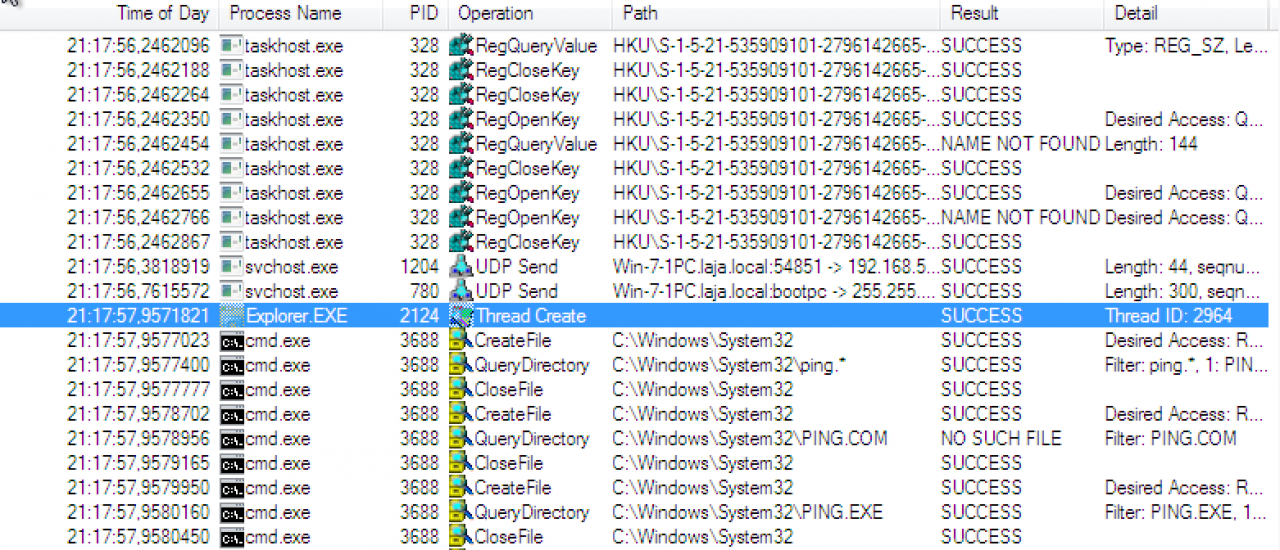
After migartion, an strange behaviour in explorer.exe is detected (opening a cmd to execute ping)
References
Advanced Penetration Testing: Hacking the World’s Most Secure Networks